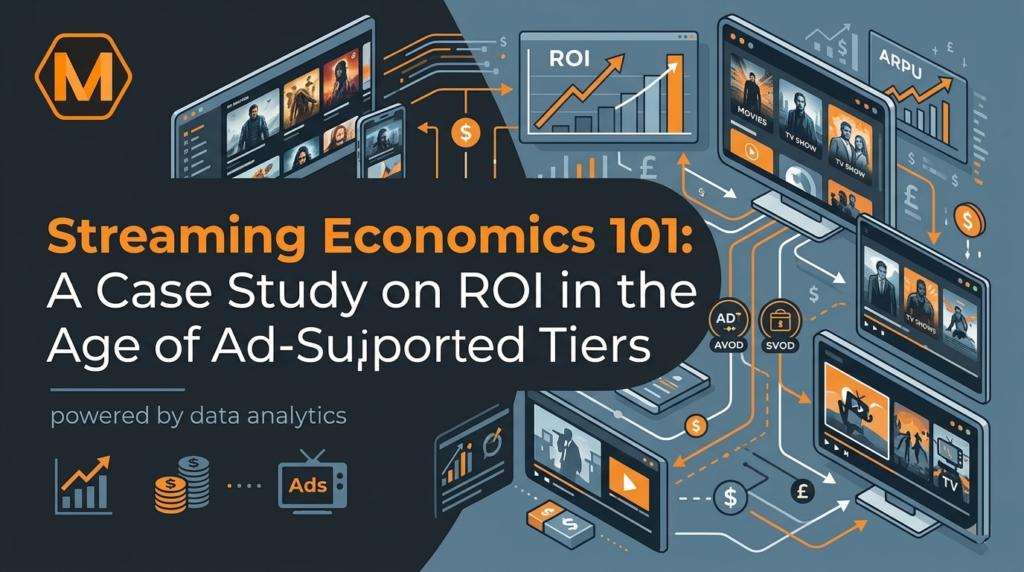
Streaming Economics 101: A Case Study on ROI in the Age of Ad-Supported Tiers
The golden age of “infinite growth” for streaming services has officially hit a wall. For years, platforms like Netflix, Disney+, and Max focused on one metric above all else: subscriber counts. However, as the global market reaches a saturation point in 2026, valued at approximately $277 billion, the industry has shifted its focus from gaining new eyes to squeezing more value out of the ones they already have. This has led to the aggressive rollout of ad-supported tiers, a move that essentially brings the business model of traditional cable television into the digital age. Understanding the economics behind this shift requires a deep dive into revenue diversification and the changing habits of global consumers.
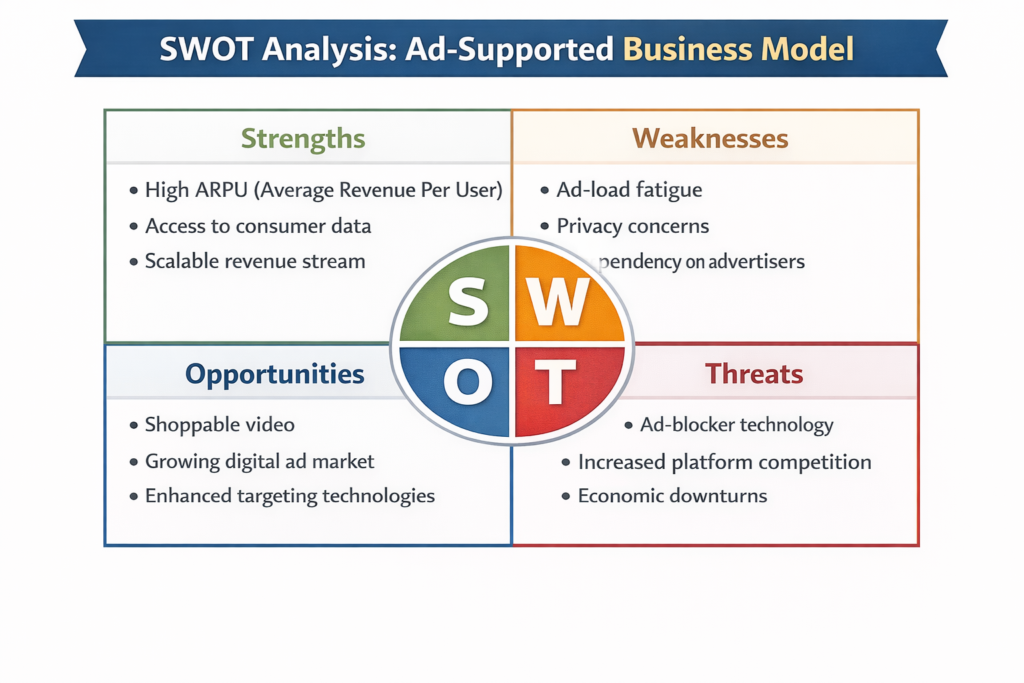
The core of this transition lies in the balance between Average Revenue Per User (ARPU) and churn rates. While a premium, ad-free subscription brings in a set monthly fee, ad-supported tiers often generate more total revenue because they combine a lower subscription price with high-value digital ad placements. For students analyzing these market shifts, finding reliable online assignment help at myassignmenthelp can provide the necessary data and case studies to understand how streaming giants calculate these complex financial outcomes. By offering a lower entry price, platforms are successfully capturing budget-conscious viewers who would have otherwise cancelled their service entirely. By early 2026, research shows that over 80% of US streaming viewers now have at least one ad-supported plan.
The Mathematics of the “Hybrid Model”
In the world of streaming economics, the “Hybrid Model” is the new gold standard. This model relies on two distinct revenue streams: the “Front-End” (the monthly subscription fee paid by the user) and the “Back-End” (the money paid by advertisers to reach that user). In many cases, the back-end revenue from ads actually exceeds the discount given to the subscriber. For example, if a premium plan costs $18 and an ad-supported plan costs $7, the platform only needs to generate more than $11 in ad revenue per month to make the ad-tier more profitable than the premium one.
This calculation involves sophisticated algorithms that track user engagement, ad-relevance, and “watch time.” Advertisers are willing to pay a premium for streaming ads because, unlike traditional TV, these ads are targeted based on specific user data. This precision reduces “ad waste” and increases the Return on Investment (ROI) for brands.
| Metric | SVOD (Subscription) | AVOD (Ad-Supported) | Hybrid (The 2026 Winner) |
| Primary Revenue | Recurring monthly fees | Advertising sales | Subscriptions + Ads |
| ARPU Stability | High (Fixed) | Volatile (Market-based) | Optimized (Highest potential) |
| Churn Risk | High (Price sensitive) | Low (Free entry) | Balanced (Lower price points) |
| Growth Potential | Saturated | High growth | Maximum scale |
Why Business Students Struggle with ROI Forecasting
As streaming becomes more data-driven, the academic requirements for media and business students have become significantly more technical. It is no longer enough to understand “storytelling”; one must now understand “data-driven greenlighting.” Forecasting the ROI of a $200 million blockbuster requires a grasp of content amortization—the process of spreading the cost of an asset over its useful life. Many students find that seeking business management assignment help is the most effective way to master the quantitative analysis and financial modeling required to pass high-level business courses.
[Diagram: The Streaming ROI Ecosystem]
(Visualize a circular flowchart: Content Investment → User Data Collection → Targeted Ad-Insertion → Higher ARPU → Re-investment in Content)
Key Metrics for 2026: Beyond Subscriber Counts
In 2026, the industry has moved past “Vanity Metrics.” Today, Wall Street analysts look at specific indicators to determine if a streaming service is healthy:
- Churn Rate: The percentage of subscribers who cancel their service. Ad-supported tiers have proven to be an “anti-churn” mechanism; as ad-free prices rose by 77% since 2020, the $7 options kept users from leaving the ecosystem entirely.
- ARPU (Average Revenue Per User): This is the ultimate measure of efficiency. In 2025, Netflix doubled its ad revenue to over $1.5 billion, proving that even a small percentage of ad-viewers can drastically boost the bottom line.
- Content Efficiency Ratio: This measures how much revenue is generated for every dollar spent on original content. It is the reason why reality TV and “FAST” (Free Ad-supported Streaming TV) channels are growing—they cost less but keep viewers engaged for ad-breaks.
Case Study: The Pivot to Ad-Tiers (Netflix vs. Disney+)
The competition between Netflix and Disney+ provides a perfect laboratory for studying these economic theories. Netflix was a late adopter of ads, initially fearing it would “tarnish” its prestige image. However, by Q3 2025, 40% of all Netflix accounts in major markets were on the “Standard with Ads” plan. This pivot allowed Netflix to crack down on password sharing while offering a cheap alternative for those who were previously “borrowing” accounts.
Disney+, on the other hand, used its ad-tier to subsidize its massive library of family-friendly content. By bundling Disney+, Hulu, and ESPN+ into a single ad-supported package, they created a “walled garden.” This strategy focuses on “ecosystem retention”—once a family is integrated into the Disney ecosystem via a cheap ad-supported plan, they are more likely to spend money on high-margin products like theme park tickets and merchandise.
The Role of Big Data in Content Acquisition
Data isn’t just used to sell ads; it’s used to decide which shows get made. Predictive analytics allow platforms to see exactly where viewers “drop off” in a pilot episode. This “mercenary” approach to creativity is controversial but undeniably effective for maximizing ROI. In 2026, the streaming analytics market is projected to reach $57 billion, highlighting how crucial these data-driven decisions have become to the business model.
For a business student, analyzing this intersection of creativity and cold, hard data is a frequent requirement. Writing a professional report on the ethics of data-driven creativity requires a synthesis of market trends, consumer psychology, and financial forecasting. This is why many future industry leaders rely on expert support to ensure their academic submissions meet the high technical standards of today’s universities.
Strategic Insights for Future Media Managers
The shift to ad-supported tiers is not a sign of weakness; it is a sign of maturity. The market has moved from the “Wild West” phase of spending billions on content to a “Consolidation” phase where efficiency is king. To succeed in this environment, future media managers must be as comfortable with a spreadsheet as they are with a screenplay.
[Table: 2026 Global Ad-Revenue Projections by Platform]
| Platform | 2025 Ad Revenue | 2026 Projection | Growth Rate |
| Hulu | $782M | $820M | 5% |
| Peacock | $761M | $1.6B | 114% |
| Netflix | $429M | $1.6B+ | 95%+ |
| Prime Video | $441M | $2.0B | 133% |
Final Takeaways for the 2026 Landscape
As we look toward the end of the decade, the line between social media and premium streaming will continue to blur. We are already seeing “shoppable ads” where viewers can buy the clothes a character is wearing directly through their remote control. This creates a “Closed-Loop ROI” that was once the holy grail of advertising.
For the modern student, this evolution represents both a challenge and an opportunity. The workload is heavier, and the technical bar is higher, but the potential to lead in a multi-billion dollar global industry is greater than ever. Whether you are analyzing Netflix’s quarterly earnings or drafting a marketing plan for a new indie platform, the goal remains the same: balancing the art of the story with the science of the bottom line.
Frequently Asked Questions
What is the difference between SVOD and AVOD? SVOD (Subscription Video on Demand) refers to services where users pay a flat monthly fee for ad-free access, such as a premium Netflix plan. AVOD (Advertising Video on Demand) provides content for free or at a deep discount, with the revenue generated through scheduled commercial breaks.
Why are streaming services moving toward ad-supported tiers?
As the global market reaches saturation, platforms can no longer rely solely on new sign-ups for growth. Ad-tiers allow companies to increase their total revenue per user by combining a smaller subscription fee with lucrative payments from advertisers.
How does “Content Amortization” affect what we see on screen?
Amortization is an accounting method that spreads the high cost of production over several years. If a show doesn’t maintain high viewership over time, it becomes a financial liability, often leading to cancellations as platforms seek more “efficient” content.
What are “Shoppable Ads” in modern streaming?
These are interactive advertisements that allow viewers to purchase products seen on screen directly through their smart TV or remote. This creates a direct link between content consumption and e-commerce, offering a more measurable return on investment for brands.
About The Author
Min Seow is a seasoned content strategist and digital media analyst specializing in the intersection of emerging technology and consumer behavior. With a focus on high-level market research and corporate ethics, Min contributes deep-dive insights to leading industry platforms. Representing MyAssignmentHelp, she is dedicated to bridging the gap between complex academic theories and real-world professional application for the next generation of global leaders.